install.packages("usethis")
usethis::use_course("https://github.com/andrewbtran/NICAR-2020-mapping/archive/master.zip")

# This section is in scripts/02_leaflet_locator_map.R
file.edit("scripts/02_leaflet_locator_map.R")leaflet basics
Let’s create a locator map like you would when searching for an address on Google Maps.
The repo containing the data and scripts for this section is on Github. To follow along, simply run the lines of code below in R.
Sometimes it’s necessary to zoom in or pan around a map for greater comprehension while exploring data spatially.
The Leaflet R package was created by the folks behind RStudio to integrate with the popular opensource JavaScript library.
It’s great for journalists who have little knowledge of JavaScript who want to make interesting interactives using R. And there is excellent documentation if you want to dig deeper into its functionality after this introduction.
Essentially, this package lets you make maps with custom map tiles, markers, polygons, lines, popups, and geojson. Almost any maps you can make in Google Fusion Tables or Carto(DB), you can make in R using the Leaflet package.
# This function checks if you don't have the correct packages installed yet
# If not, it will install it for you
packages <- c("dplyr", "httpuv", "readr", "leaflet", "sf")
if (length(setdiff(packages, rownames(installed.packages()))) > 0) {
  install.packages(setdiff(packages, rownames(installed.packages())), repos = "https://cran.us.r-project.org")
}

library(leaflet)
library(dplyr)
Putting a marker on a map
Let’s begin by finding a latitude and longitude to map.
Go to Google Maps and search for any address.
Right click on the map until you get this menu.

Select “What’s here?” and at the bottom copy and paste that latitude and longitude.

- Create a map widget by calling the
leaflet()function - Add layers (such as features) to the map by using layer functions
- like
addTiles,addMarkers,addPolygons
- like
- Print the map widget
- Customize the view port zoom and center location with
setView()
# Insert your latitude and longitude in the code below
# NOTE: Don't get them reversed otherwise you'll end up in the South Pole.

# Initialize and assign m as the leaflet object
m <- leaflet() %>%
# Now add tiles to it
    addTiles() %>%
# Setting the middle of where the map should be and the zoom level
    setView(lng=-77.030137, lat=38.902986, zoom = 16) %>%
# Now, add a marker with a popup,
    addMarkers(lng=-77.030137, lat=38.902986, popup="<b>Hello</b><br><a href='https://www.washingtonpost.com'>-Me</a>")

m
Go ahead and click the blue marker.
Explaining the R code
leaflet()initializes the leaflet work spaceaddTiles()by itself will bring in the default OpenStreetMap tiles- Here’s a list of free leaflet tiles you can use
- Note: OpenStreetMaps is a wonderful and free open-source service. Their only stipulation for using their tiles is to be sure to credit and link to them in the map.
setView()is pretty self-explanatory but is simpler to implementaddMarkers()with some specific parameters.
Note: The order of commands is important. A view can’t be set unless there are tiles established first.
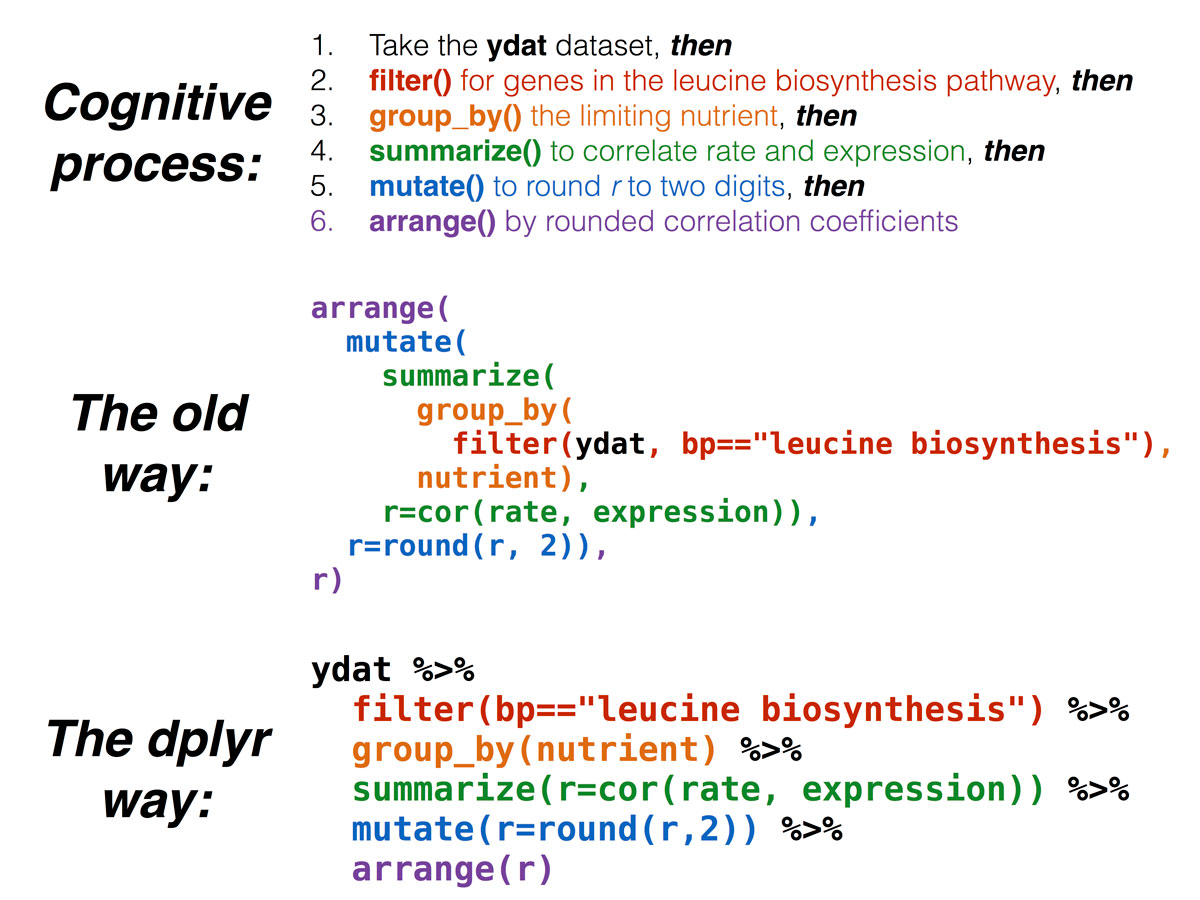
Another note: We’re using pipes (%>%) in our code, which is part of dplyr/magrittr. It’s a form of R syntax that has sort of revolutionized legible coding. Here’s a quick breakdown:
To learn more about pipes, visit any number of tutorials.
Multiple locations from a csv
Let’s bring in some new data based on pharmacies. This is opioid pain pill data for Louisiana between 2006 and 2012 via the arcos api (shameless self-promotion here since I made this api with R and the plumber and pkgdown packages).
library(readr)

pharmacies <- read_csv("data/all_pharmacies_summarized.csv")

glimpse(pharmacies)
Rows: 82,813
Columns: 17
$ BUYER_DEA_NO <chr> "BR5156078", "BW4707139", "BN5150141", "FH2332233",…
$ BUYER_STATE <chr> "AL", "AL", "AL", "AL", "AL", "AL", "AL", "AL", "AL…
$ BUYER_COUNTY <chr> "BALDWIN", "BALDWIN", "BALDWIN", "BALDWIN", "BALDWI…
$ lat <dbl> 30.8804, 30.8859, 30.9046, 30.8838, 30.8826, 30.884…
$ lon <dbl> -87.7845, -87.7867, -87.7839, -87.7893, -87.7734, -…
$ total_dosage_unit <dbl> 1901530, 1481300, 1308370, 326720, 231570, 132680, …
$ total_records <dbl> 2056, 6035, 3902, 1400, 936, 289, 35, 11, 1232, 589…
$ countyfips <chr> "01003", "01003", "01003", "01003", "01003", "01003…
$ average_population <dbl> 175270, 175270, 175270, 175270, 175270, 175270, 175…
$ per_person <dbl> 1.5, 1.2, 1.1, 0.3, 0.2, 0.1, 0.0, 0.0, 1.8, 0.8, 3…
$ BUYER_BUS_ACT <chr> "CHAIN PHARMACY", "CHAIN PHARMACY", "RETAIL PHARMAC…
$ BUYER_NAME <chr> "ALABAMA CVS PHARMACY, L.L.C.", "WINN-DIXIE PHARMAC…
$ BUYER_ADDRESS1 <chr> "208 MCMEANS AVE.", "710 MCMEANS AVE", "2012 HAND A…
$ BUYER_CITY <chr> "BAY MINETTE", "BAY MINETTE", "BAY MINETTE", "BAY M…
$ BUYER_ZIP <dbl> 36507, 36507, 36507, 36507, 36507, 36507, 36535, 36…
$ BUYER_ADDL_CO_INFO <chr> "DBA: CVS/PHARMACY # 04938", NA, NA, "DBA BELL'S H…
$ BUYER_ADDRESS2 <chr> NA, NA, NA, NA, NA, NA, NA, "SUITE 101", NA, "69005…We’ve imported more than 82,000 rows of data on pharmacies across the U.S. and how many opioids they ordered between 2006 and 2012. If you’d like to see the script that generated this data, check out the state_pharm_data.R script.
Let’s limit it to a single state because tens of thousands of dots on a slippy map is taxing on a browser. Maybe we’ll get more ambitious later.
# Pick a state, any state.
# I'll use Louisiana here because that's where NICAR is this year

pharm_state <- pharmacies %>%
  filter(BUYER_STATE=="LA")
Let’s make a map with a new tile set. Instead of leaving addTiles() empty, which uses the OpenStreetMap default, we’ll pass on some new data to some other third-party tiles with the addProviderTiles() function. Check out all the neat tile options.
Some options to use with addCircles includes the data to pull in for popup and color, which we’ve made bright orange. We’ve also set radius and weight and fillOpacity.
If we wanted to change the radius of the circle based on some data point, you could replace 40 with some column with numeric values in it.
And of course we have to change the latitude and longitude values in setView() so they focus on the state we filtered.
m <- leaflet(pharm_state) %>% addProviderTiles(providers$CartoDB.DarkMatter) %>%
  setView(-92.469698, 31.012156, zoom = 7) %>%
  addCircles(~lon, ~lat, popup=pharm_state$BUYER_NAME, weight = 3, radius=40,
                 color="#ffa500", stroke = TRUE, fillOpacity = 0.8)
m
That’s a start but we can do better.
We can reflect the average number of pills per person per year by the size of the circles.
To do that, we must switch from addCircles to addCircleMarkers.
Change that in the radius variable below.
And we’ll adjust the pop up language with some basic html.
# we also have to rearrange the order of the dataframe
# so the smaller values will render over the larger ones
# this means big circles won't block the small circles

pharm_state <- pharm_state %>%
  arrange(desc(per_person))

m <- leaflet(pharm_state) %>%
  addProviderTiles(providers$CartoDB.DarkMatter) %>%
  setView(-92.469698, 31.012156, zoom = 7) %>%
  addCircleMarkers(~lon, ~lat,
             popup=paste0(pharm_state$BUYER_NAME, "<br />",
                          pharm_state$per_person, " pills per person per year"),
             weight = 3,
             radius=sqrt(pharm_state$per_person)*3,
             color="#ffa500",
             stroke = FALSE,
             fillOpacity = 0.3)
m
Why stop there?
Let’s make some style changes based on the data we have.
Like, we can visualize the BUYER_BUS_ACT with colors.
cof <- colorFactor(c("#ffa500", "#13ED3F"), domain=c("CHAIN PHARMACY", "RETAIL PHARMACY"))
# mapping based on type
m <- leaflet(pharm_state) %>%
  addProviderTiles(providers$CartoDB.DarkMatter) %>%
  setView(-92.469698, 31.012156, zoom = 7) %>%
  addCircleMarkers(~lon, ~lat,
             popup=paste0(pharm_state$BUYER_NAME, "<br />",
                          pharm_state$per_person, " pills per person per year"),
             weight = 3,
             radius=sqrt(pharm_state$per_person)*3,
             stroke = FALSE,
             fillOpacity = 0.3,
             # this line below is really the only thing that's different
             color=~cof(BUYER_BUS_ACT))
m
Play around with the slippy map. Interesting, right?
Still, that’s a lot of points to process. I don’t recommend more. Unless you switch to a method that won’t slow your browser down, which we’lll get into soon.
Add a legend
Let’s add a legend with the function addLegend() and options for where to place it and colors and labels.
m <- leaflet(pharm_state)  %>%
  addProviderTiles(providers$CartoDB.DarkMatter) %>%
    setView(-92.469698, 31.012156, zoom = 7) %>%
  addCircleMarkers(~lon, ~lat,
             popup=paste0(pharm_state$BUYER_NAME, "<br />",
                          pharm_state$per_person, " pills per person per year"),
             weight = 3,
             radius=sqrt(pharm_state$per_person)*3,
             stroke = FALSE,
             fillOpacity = 0.3,
             color=~cof(BUYER_BUS_ACT))   %>%
             # this line below is really the only thing that's different
             addLegend("bottomright",
                       colors= c("#ffa500", "#13ED3F"),
                       labels=c("Chain", "Retail"),
                       title="Pharmacy type")

m
Add a more specific legend
Let’s add circles to the legend.
We want to add some customization to the legend to reflect the radius size on the map. This isn’t among the default functions in the rleaflet package, but it’s doable if you know how the underlying code works both in leaflet and rleaflet.
# set legend features
        colors <- c("gray", "gray", "gray", "#ffa500", "#13ED3F")
        labels <- c("5 pills", "15 pills", "30 pills", "Chain", "Retail")
        sizes <- c(sqrt(5)*3, sqrt(15)*3, sqrt(30)*3, 15, 15)
        shapes <- c("circle", "circle", "circle", "square", "square")
        borders <- c("gray", "gray", "gray", "#ffa500", "#13ED3F")

addLegendCustom <- function(map, colors, labels, sizes, shapes, borders, opacity = 0.5){

            make_shapes <- function(colors, sizes, borders, shapes) {
                shapes <- gsub("circle", "50%", shapes)
                shapes <- gsub("square", "0%", shapes)
                paste0(colors, "; width:", sizes, "px; height:", sizes, "px; border:3px solid ", borders, "; border-radius:", shapes)
            }
            make_labels <- function(sizes, labels) {
                paste0("<div style='float: right; display: inline-block;height: ",
                       sizes, "px;margin-top: 4px;line-height: ",
                       sizes, "px;'>", labels, "</div>")
            }
            legend_colors <- make_shapes(colors, sizes, borders, shapes)
            legend_labels <- make_labels(sizes, labels)

            return(addLegend(map, colors = legend_colors, labels = legend_labels, opacity = opacity))
        }

## okay, back to our map code but replacing the addLegend() function
## with our new addCustomLegend() function

m <- leaflet(pharm_state)  %>%
  addProviderTiles(providers$CartoDB.DarkMatter) %>%
    setView(-92.469698, 31.012156, zoom = 7) %>%
  addCircleMarkers(~lon, ~lat,
             popup=paste0(pharm_state$BUYER_NAME, "<br />",
                          pharm_state$per_person, " pills per person per year"),
             weight = 3,
             radius=sqrt(pharm_state$per_person)*3,
             stroke = FALSE,
             fillOpacity = 0.3,
             color=~cof(BUYER_BUS_ACT))   %>%
             # this line below is really the only thing that's different
             addLegendCustom(colors, labels, sizes, shapes, borders)

m
But what about all those other dots…
Okay, fine, I know you’re tempted.
What if you visualized all of those dots without filtering first?
Well, it’d crash RStudio and probably your browser.
So let me show you how to do it if you really want to.
We have to use a WebGL plugin to render those dots well.
# leafgl is not yet on CRAN
# so uncomment and run the instlal line below

#devtools::install_github("r-spatial/leafgl")

library(leafgl)
library(sf)

# Convert the latitude and longitude into a geometry for easy mapping
pharms_spatial <- pharmacies %>%
  st_as_sf(coords=c("lon", "lat"), crs = "+proj=longlat")

m <- leaflet() %>%
    addProviderTiles(provider = providers$CartoDB.DarkMatter) %>%
    addGlPoints(data = pharms_spatial,
                opacity=.5,
                popup="BUYER_NAME",
                group = "BUYER_BUS_ACT") %>%
    setView(-92.469698, 31.012156, zoom = 3) %>%
    addLayersControl(overlayGroups = "BUYER_BUS_ACT")

m
The downside?
This new package can’t render circles of varying size yet.
So this is great for dot density maps, polygons, and lines but little else.
For now.